On a topographic map, a contour line is a line that depicts ground elevation or depression. The vertical distance or difference in elevation between contour lines is known as a contour interval. Every sixth contour line has an index contour, which is a bolder or thicker line.
The height of the land rises as the numbers linked with certain contour lines rise. There is a reduction in elevation as the numbers connected with the contour lines decrease. The contour lines turn upstream when they reach a creek, canyon, or drainage region. They then construct a “v” down the other bank of the creek. A rounded contour suggests a drainage or spur that is flatter or bigger. Contour lines often include the tiny places on ridge tops, which are typically narrow and confined in size. Ridges with pointy ends are represented as sharp contour points.
For area charting, the contour intervals are assumed, and the contour intervals are indicated on the right-hand side.
If the contour interval isn’t specified on the map, the parts below may be useful. The most typical contour interval for a 1: 24,000 map scale is 20 feet.
Factors that influence the selection of a contour interval
- Scale selected for the map
- The extent to which the survey is being performed
- The type of ground available
- Th different resources available
- The time available for the project
Also Read: Difference between Plane Surveying and Geodetic Surveying
Method of calculating contour intervals from map
A contour map depicts the contour lines of a certain geographic location.
To make the contour map simple and easy to understand, every contour line is not called by its elevation; these marked or labelled lines are designated or known as index contour lines.
The following formula is used to compute the contour intervals:
Step1: To begin, locate the two index contour lines that can be given a height designation.
Step 2: Using a map, calculate the difference between the two index contour lines you choose. To calculate the difference, subtract the top elevation line from the bottom elevation line.
Step 3: In the contour interval between the two indexed contour lines chosen in the preceding step, count the number of non-index contour lines.
Step 4: Multiply the number of lines obtained in the previous step by one. If the number of rows between two index lines is 5, for example, add 1 to 5, which equals 6.
Step 5: The quotient of the difference between the index lines (step 2) and the number of lines between the two index lines plus one is calculated in the third step (step 5).
Step 6: To reach the result, divide the contour intervals of the topographic map in question.
Also Read: Digital Level Surveying – Advantages – Component – Types
Examples
Example 1: Calculating Contour Interval
Considering the map, the following steps are used to calculate the contour intervals calculation as follows:
Let’s say, 7000 and 7100 and calculate the interval between them.
Now the difference between 7100 and 7000 is 7100 – 7000 = 100.
The variety of contour lines is 4 between 7000 and 7100.
Add 1 to 4, 4 + 1 = 5
Now divide 100 by 5,
100/5 = 20 units
The contour interval of the above map gave us 20 units.
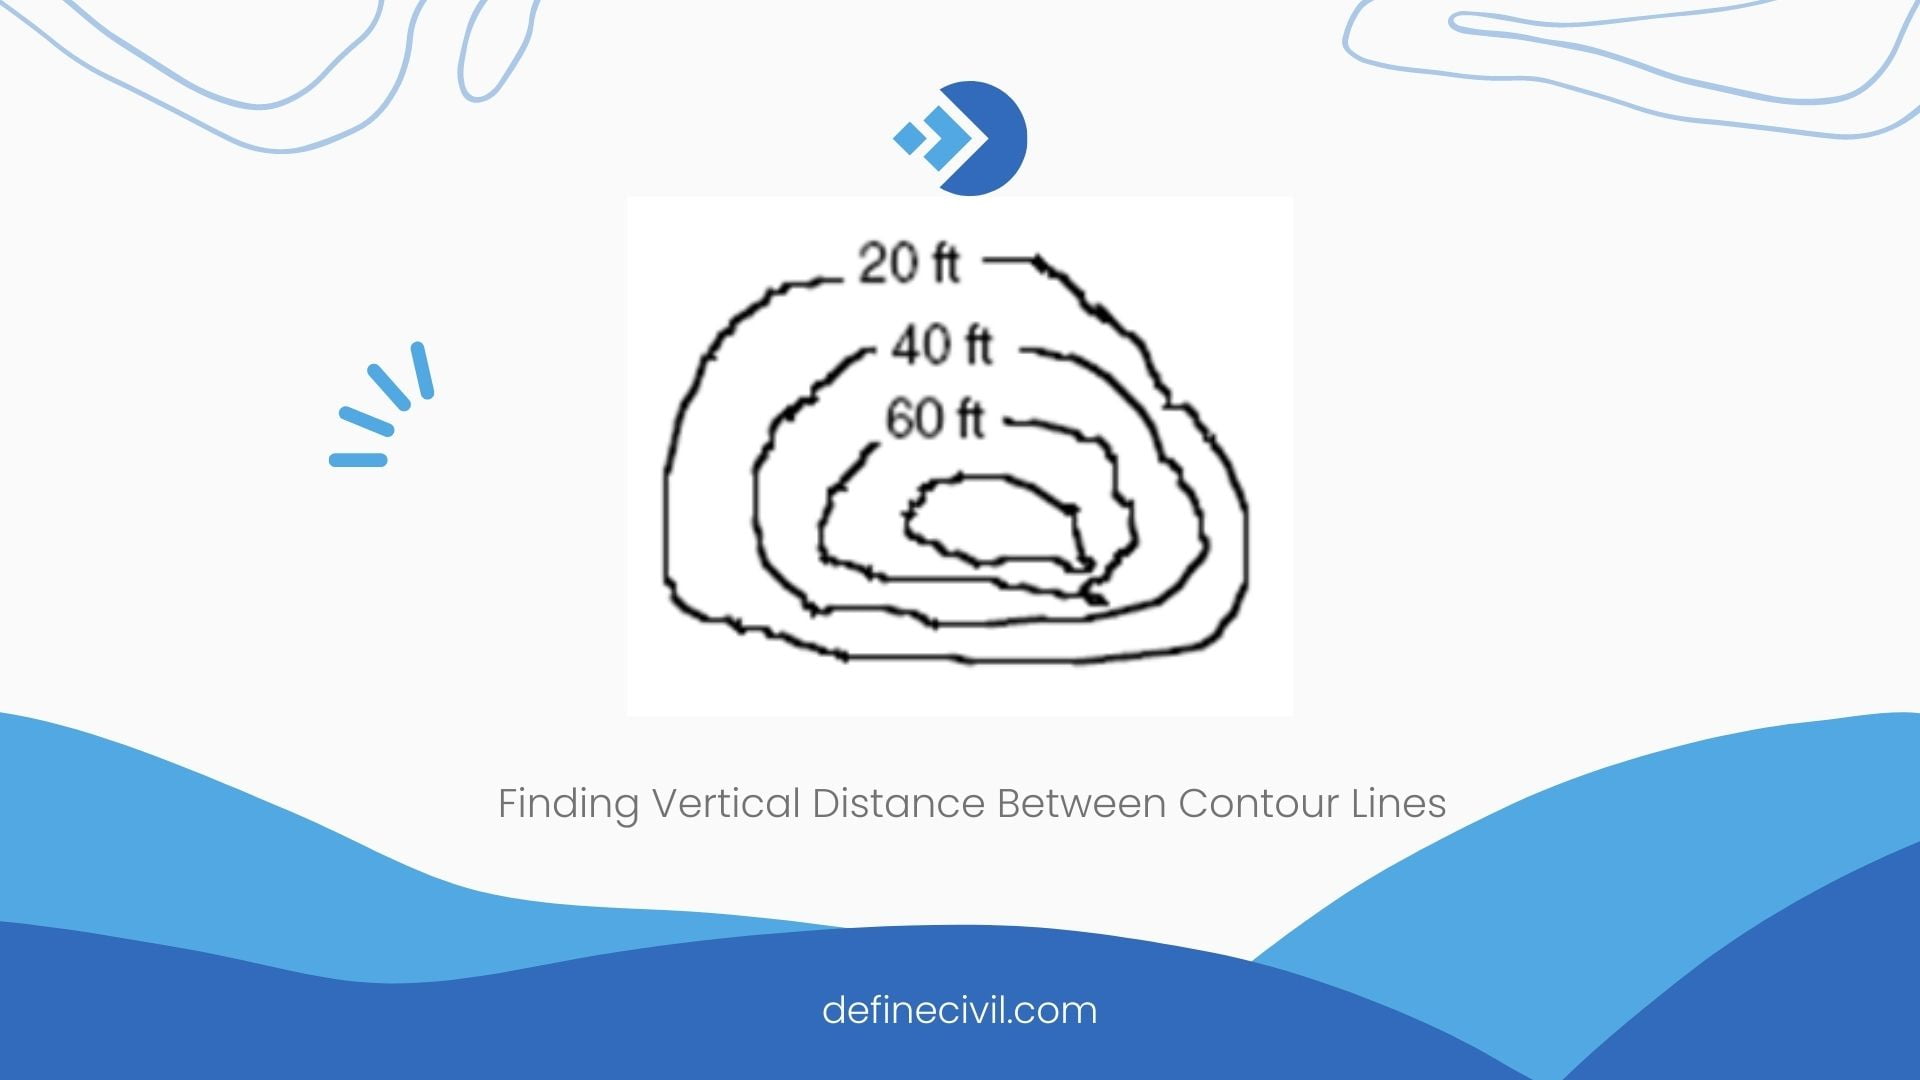
Example 2: Finding Vertical Distance Between Contour Lines
Find the difference between two contour lines in linked numbers that are next to each other.
A 20-foot distance minus a 40-foot distance equals a 20-foot distance.
In this diagram, the contour lines are evenly spaced. The hill’s uniform slope is indicated by the even spacing. A landscape profile can be created using the contour map.
Example 3: Make a profile that illustrates the contours’ elevations.
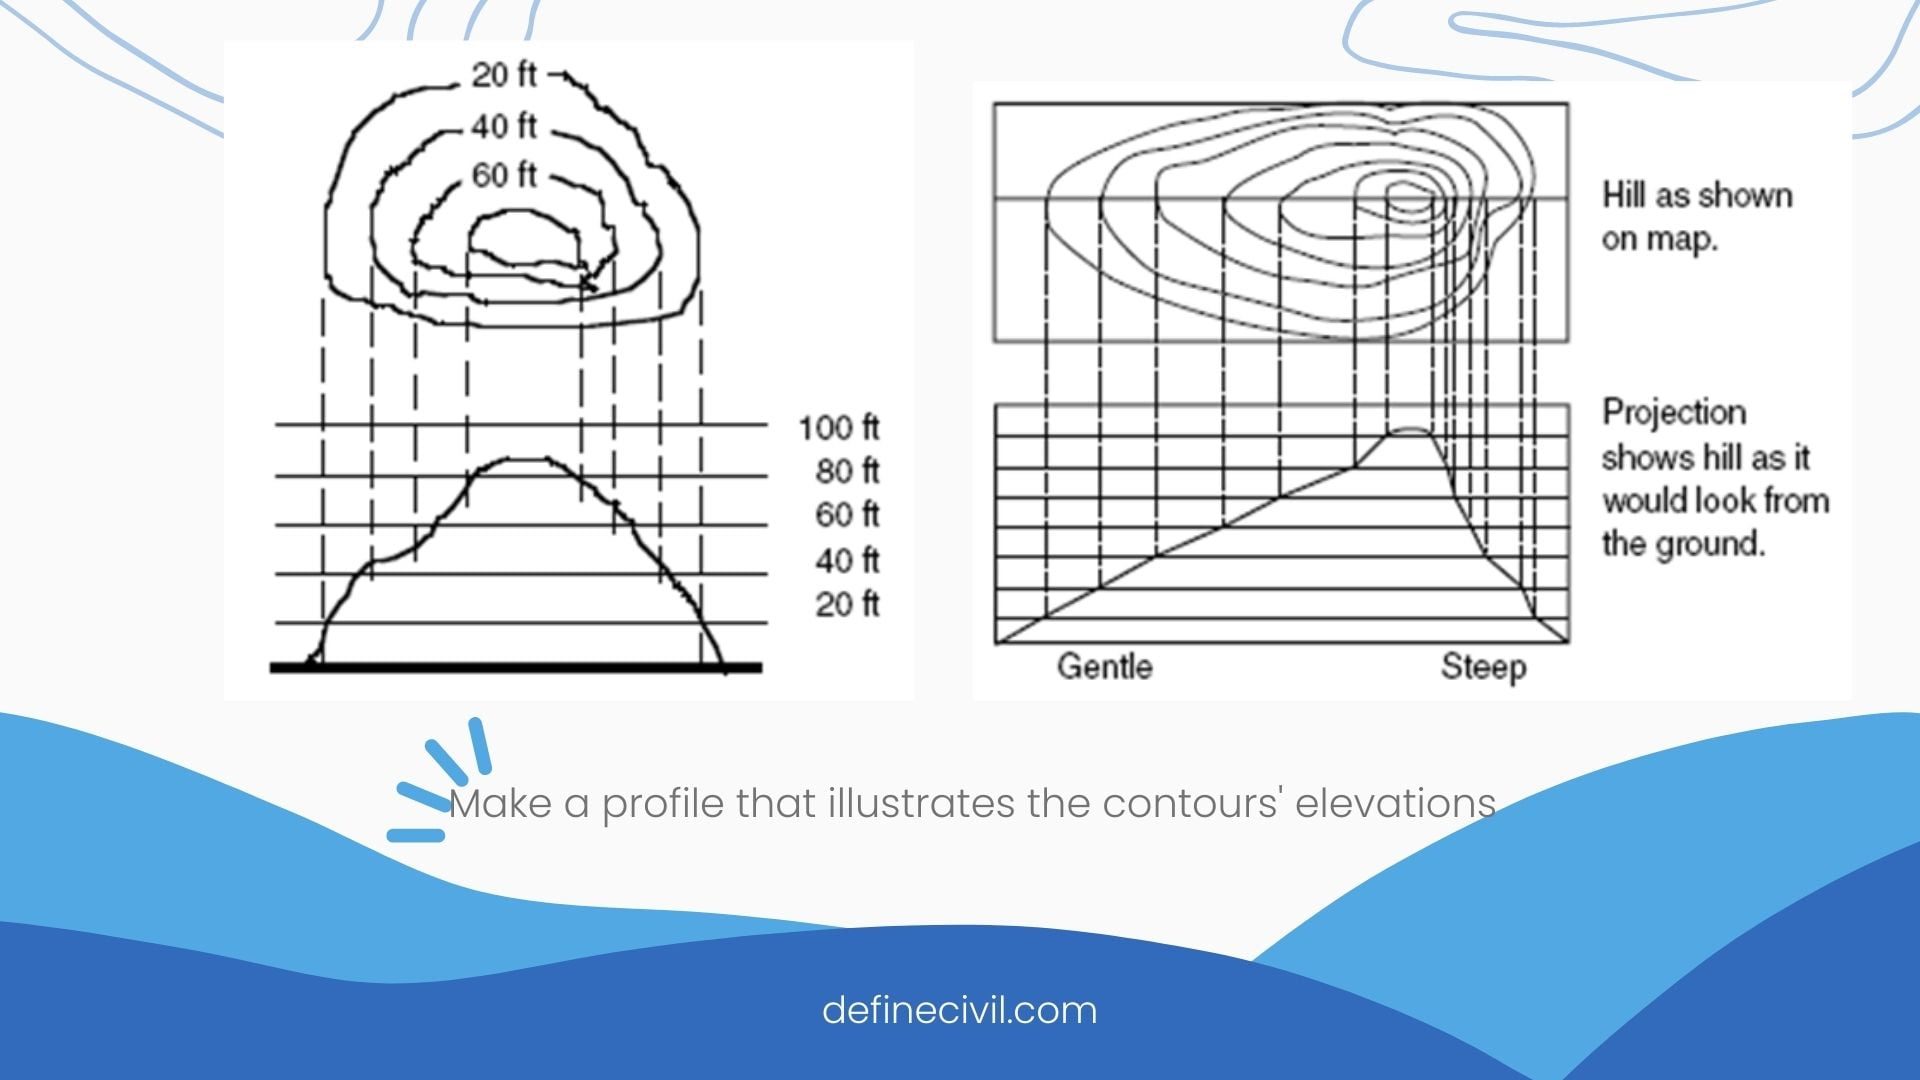
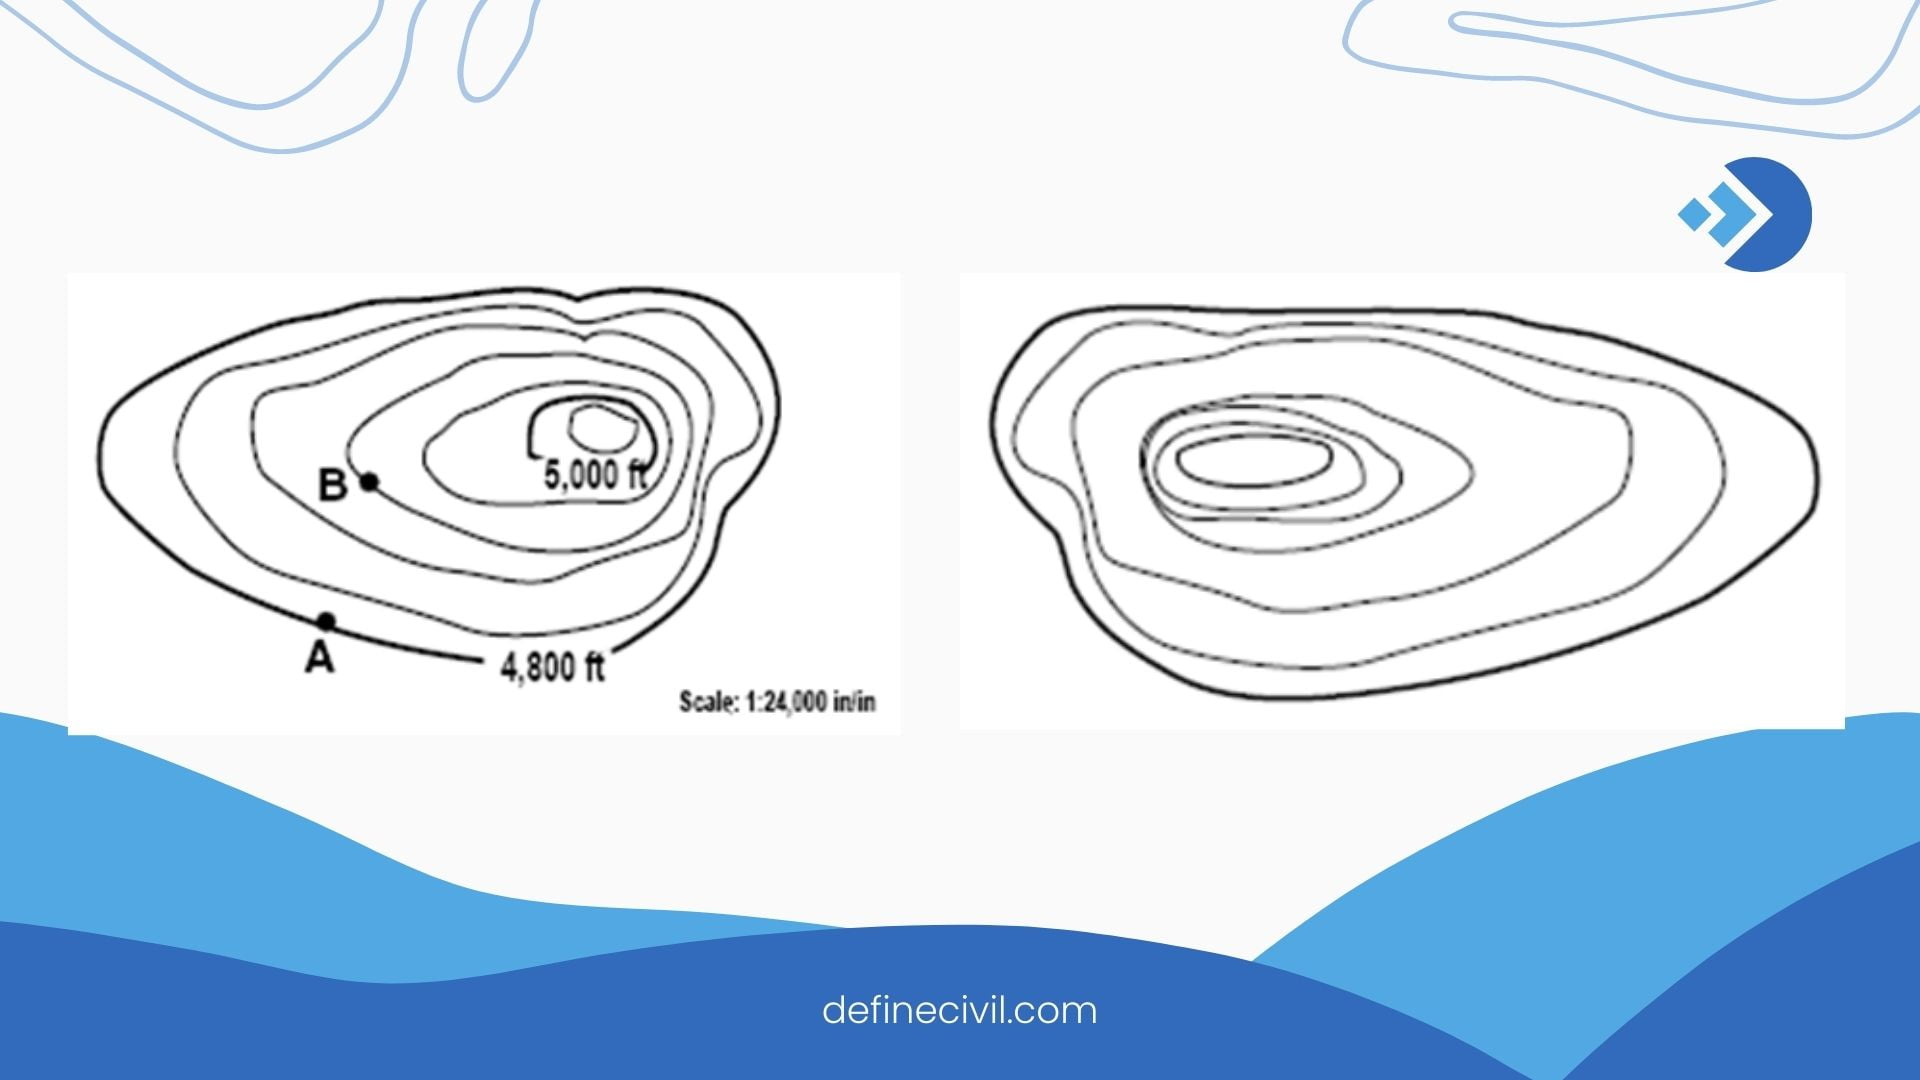
The contours suggest a hill because the intervals are growing. The peak is usually regarded to be half the interval distance away in most circumstances.
A moderate slope is suggested by contour lines that are far apart. A steep slope is shown by contour lines that are close together.
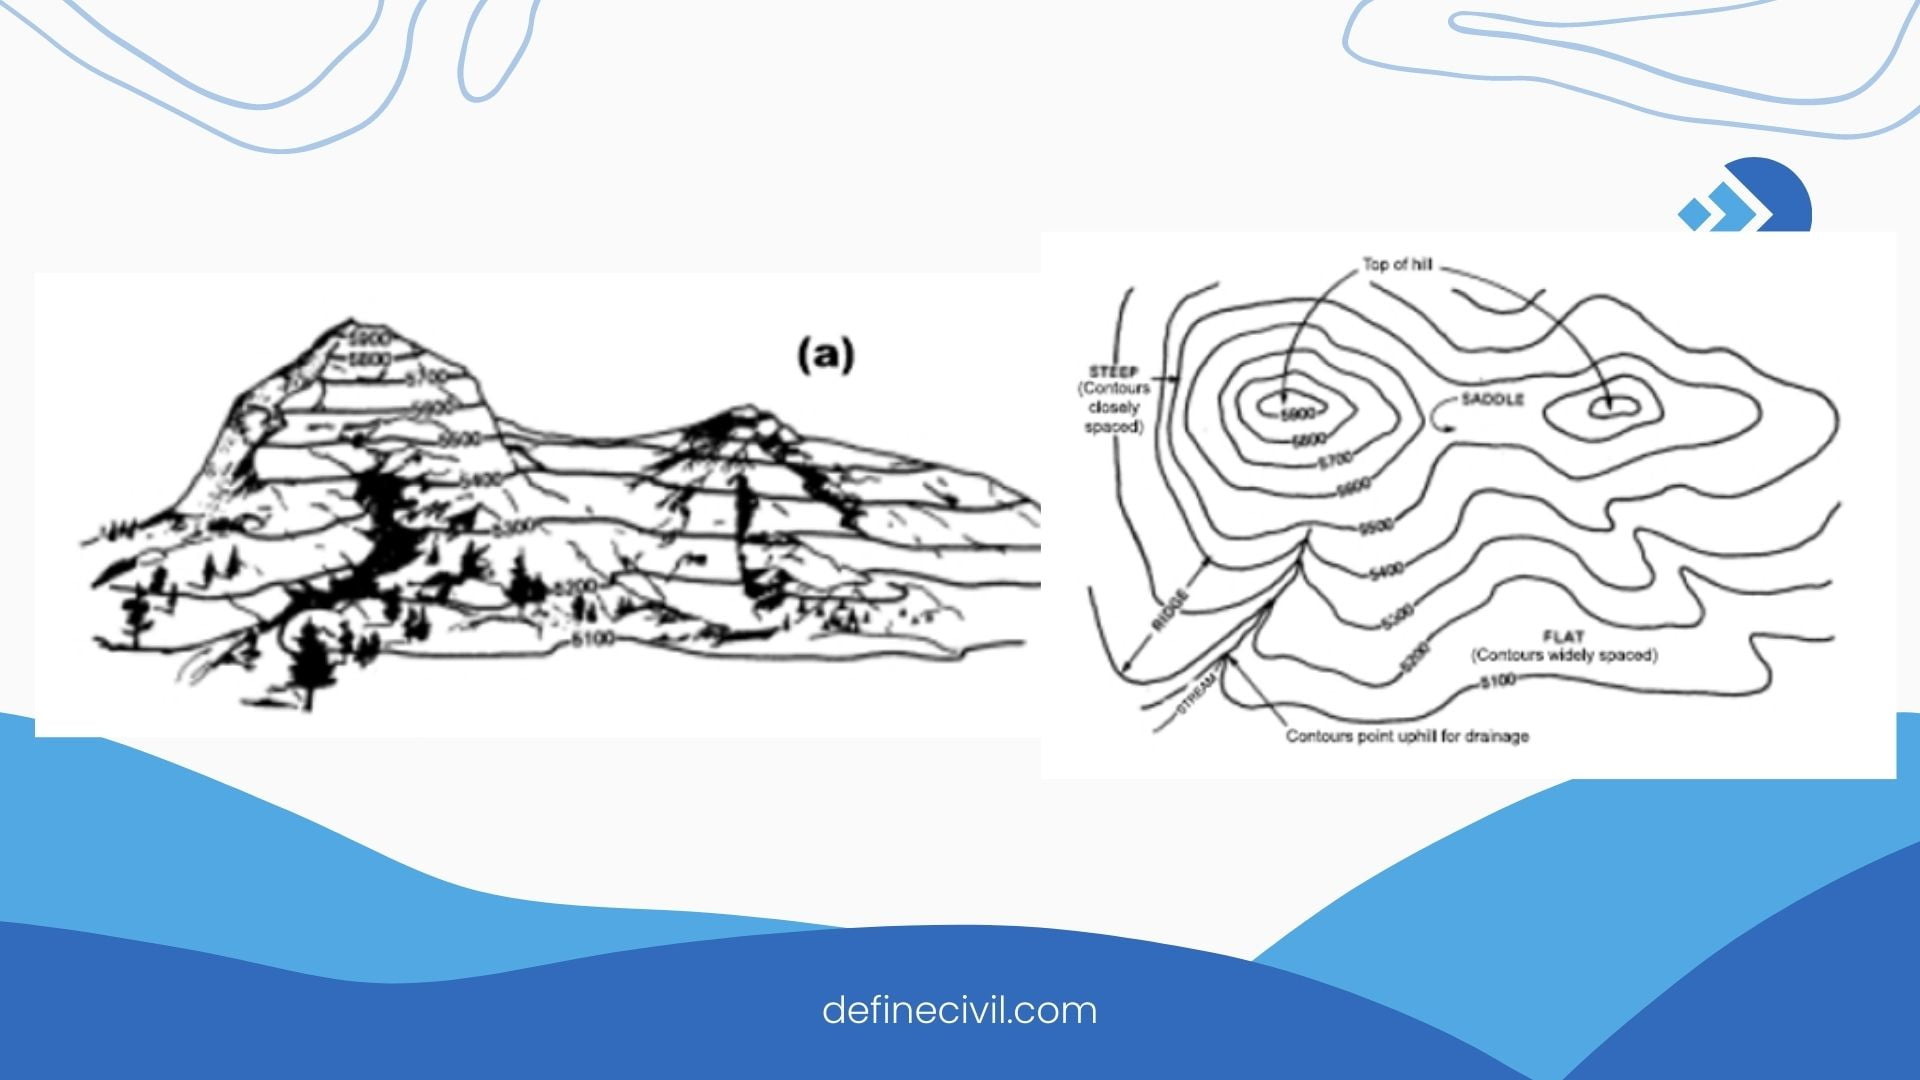
Several terrain features are depicted in the diagram above. (a) Take note of how contour lines are used to depict a mountain saddle, ridge, stream, steep part, and level ground.
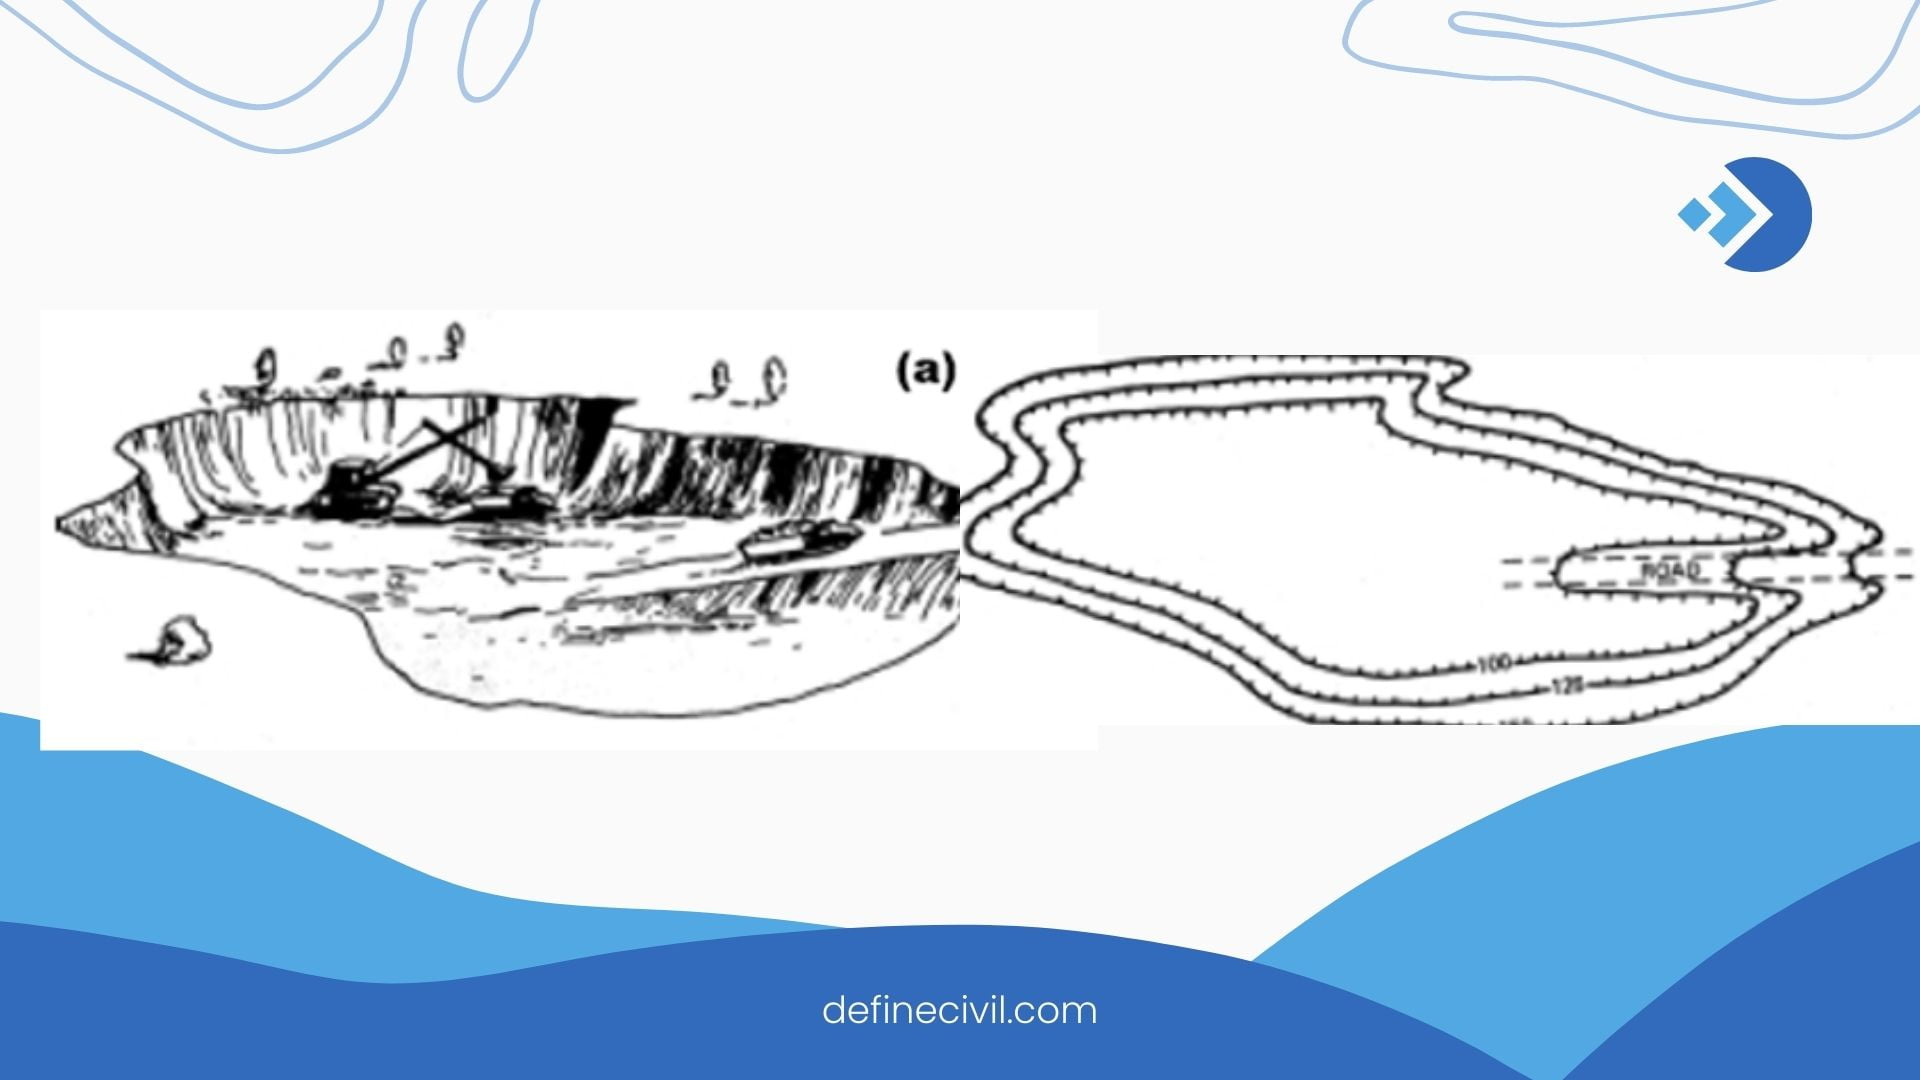
The illustration above demonstrates how contour lines can be used to depict a depression. On the way downward, keep an eye out for ticks.
Implementations of the contour intervals in the field of surveying
When a large area needs to be mapped onto a little piece of paper, contour interval is used.
For a larger region, a longer contour interval is utilized, while for a smaller area, a shorter contour interval is employed.
On a larger map, index contour lines are significantly fewer to keep the map simple to understand.
The contour interval determines the height of the intermediate point.
For a bridge, dam, or road, the contour intervals on the map can be utilized to compute earthquakes.
Also Read: [PDF] Download Surveying Leveling Books Free (22.5 MB Files)
Distinction between a contour interval itself and horizontal equivalent:
| Contour Interval | Horizontal Equivalent |
| The contour interval is used to calculate a location’s vertical elevation. | The distance between two variables on two contour lines with a specific slope on the horizontal plane is called the horizontal equivalent. |
| On a vertical plane, it refers to the distance between two points. | On a horizontal plane, it represents the distance between two points. |
| Because contour levels are displayed on contour lines, there is no need for measuring or scaling. | To convert the value to actual distance, the distance must be measured on the map and multiplied by the map’s size. |
| On a particular map, the contour interval is fixed. | The slope affects the horizontal level; shorter lengths imply a sharper slope, whereas longer distances indicate a softer slope. |